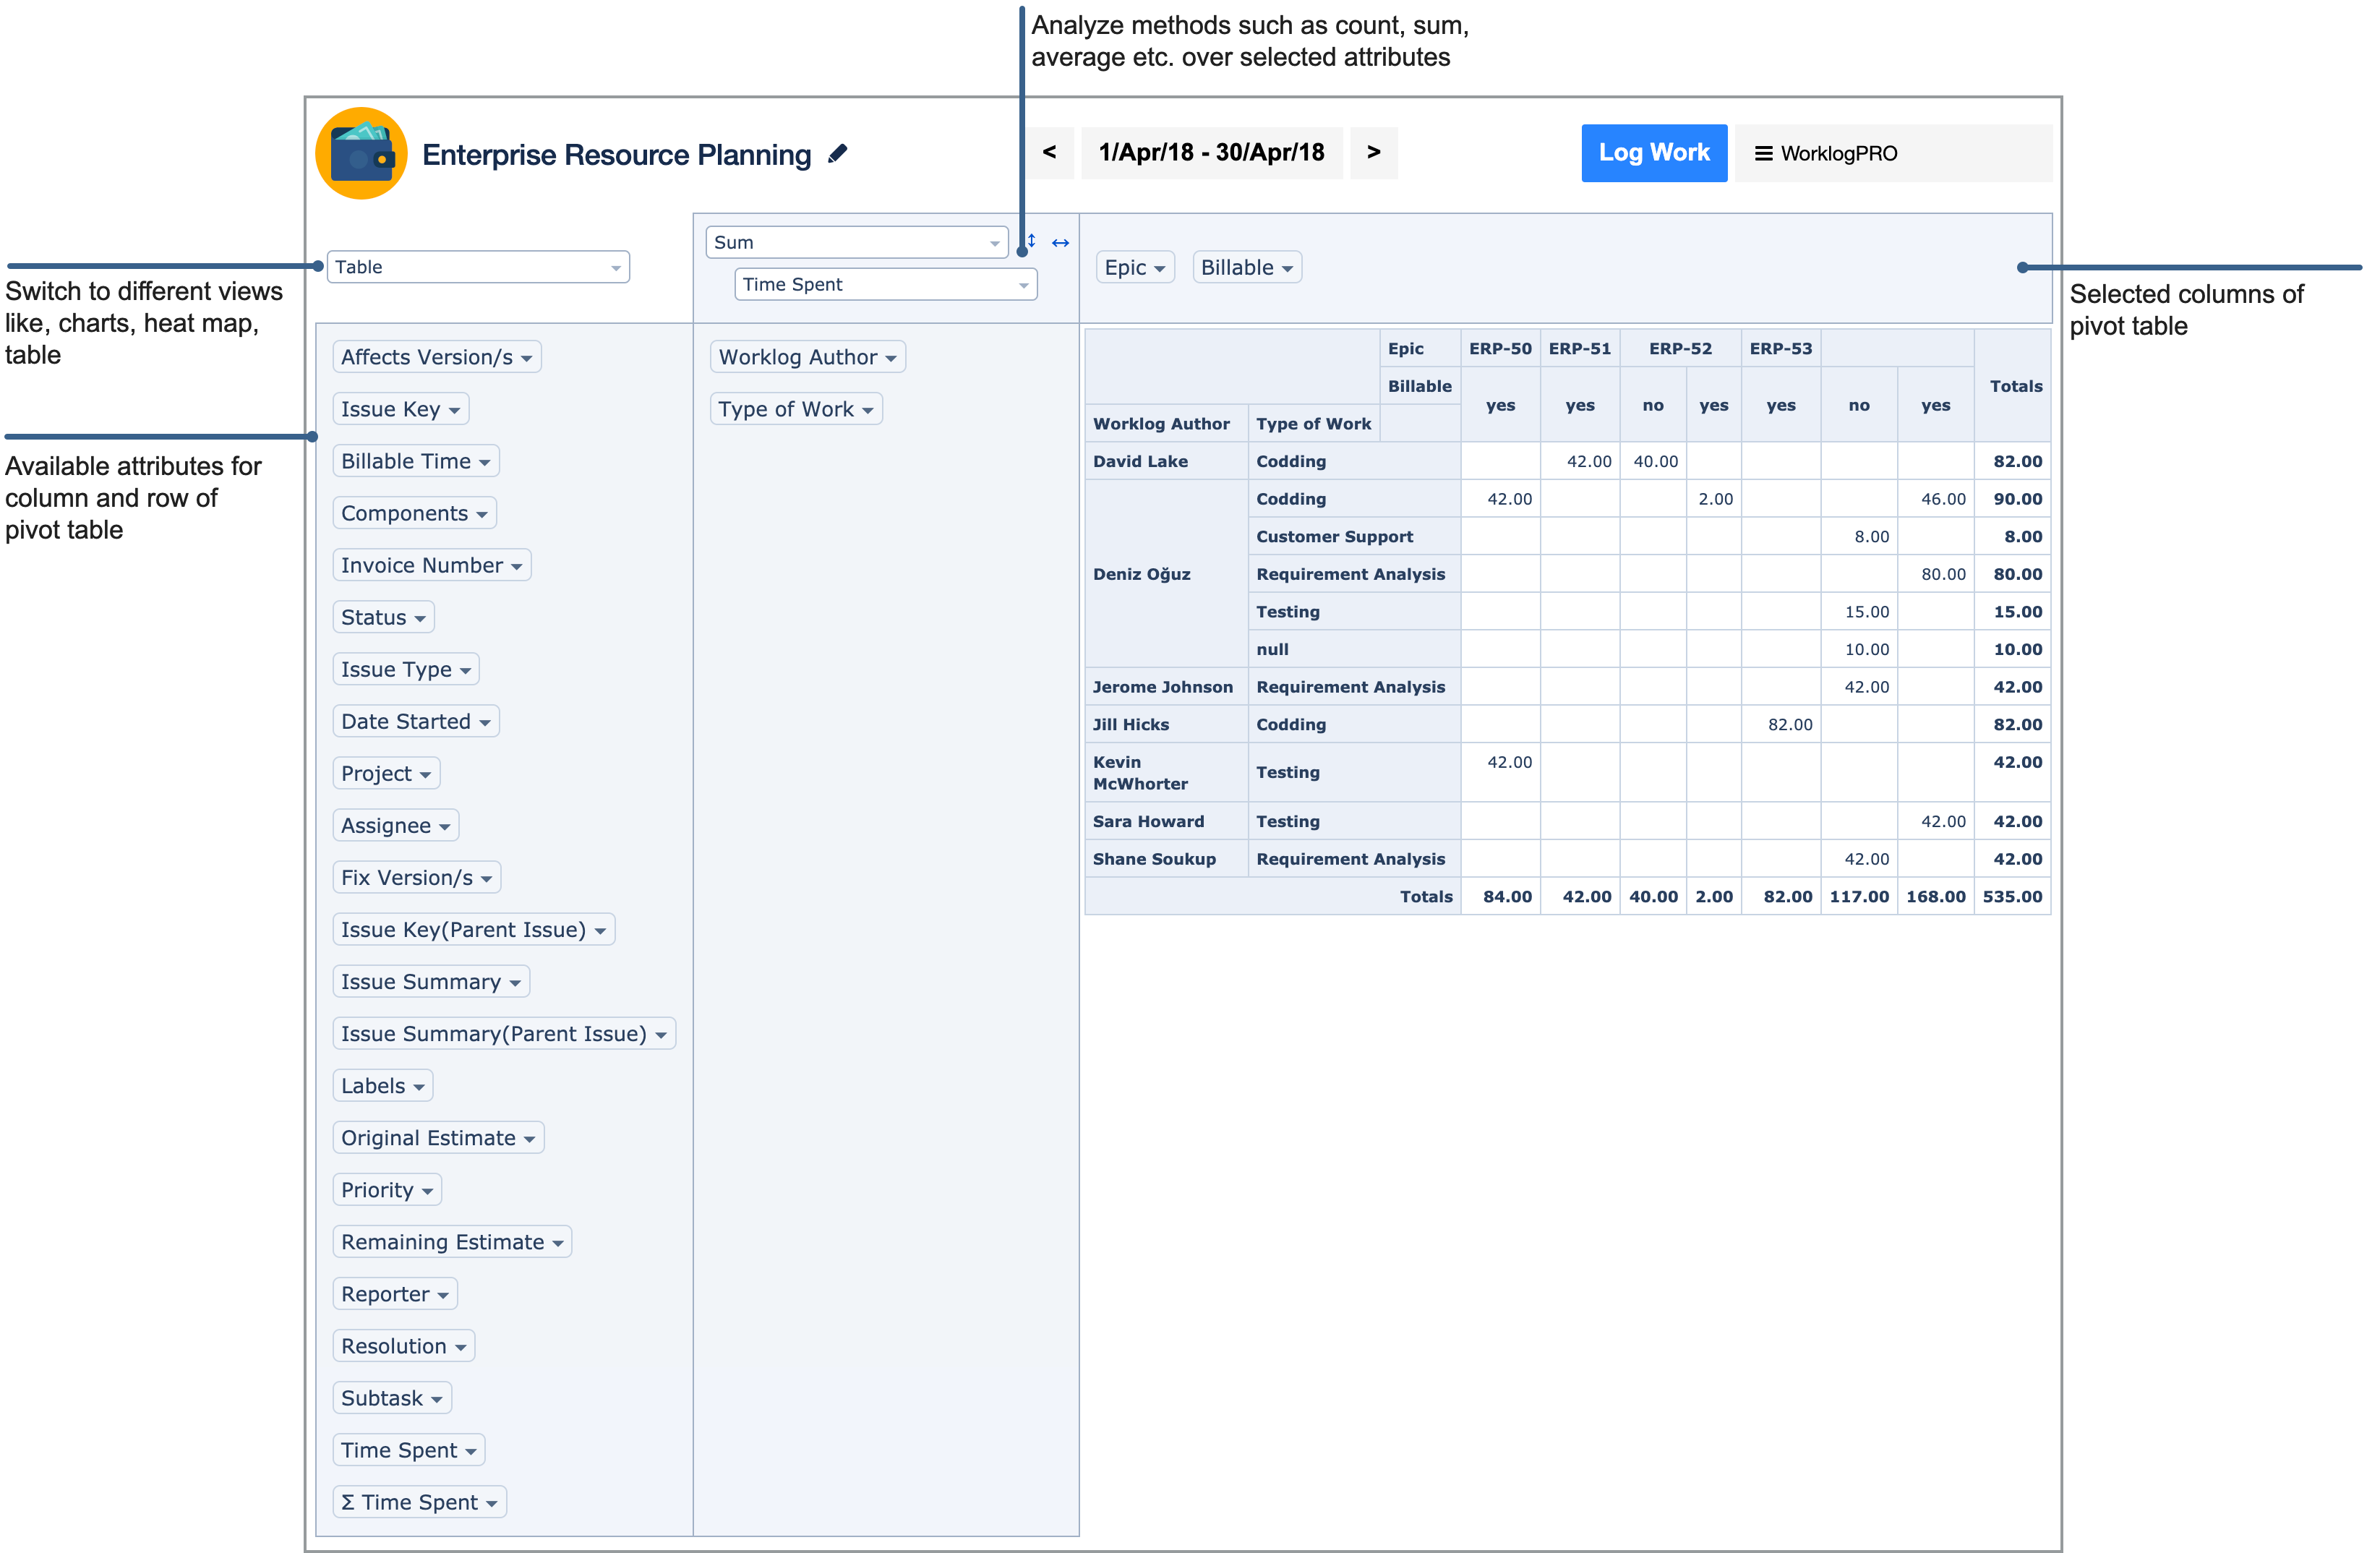
Pivot tables are a technique in data processing. They enable a person to arrange and rearrange (or "pivot") statistics in order to draw attention to useful information. Since 3.5.1 version of WorklogPRO you can switch to "Pivot Report" view and analyze worklog data without needing to export it to Excel.
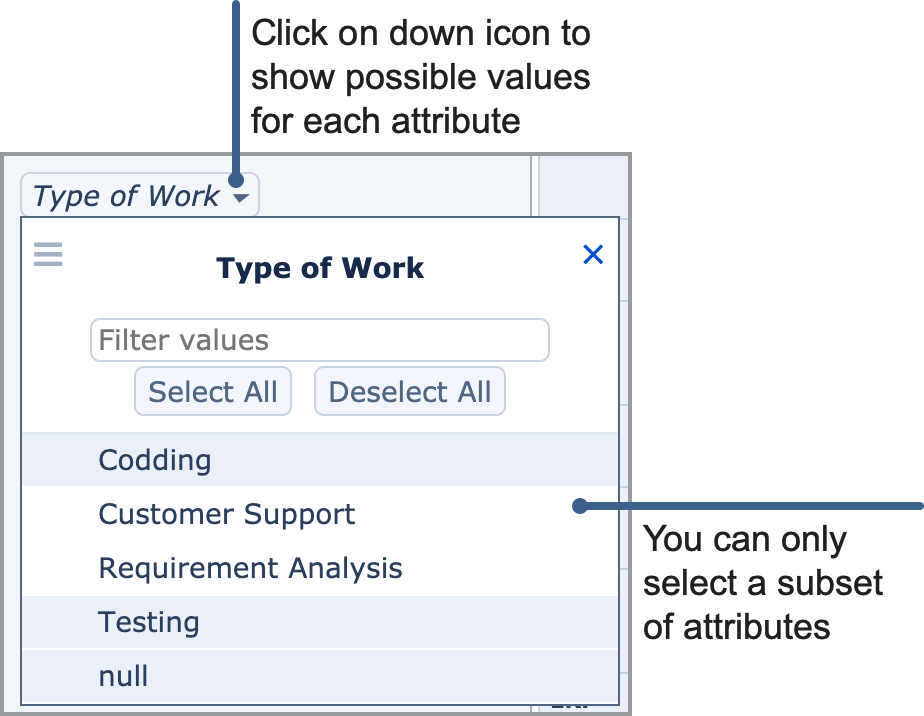
You can filter values used for analyses for each attribute. Clicking on down icon next to an attribute opens a filter panel for that attribute.
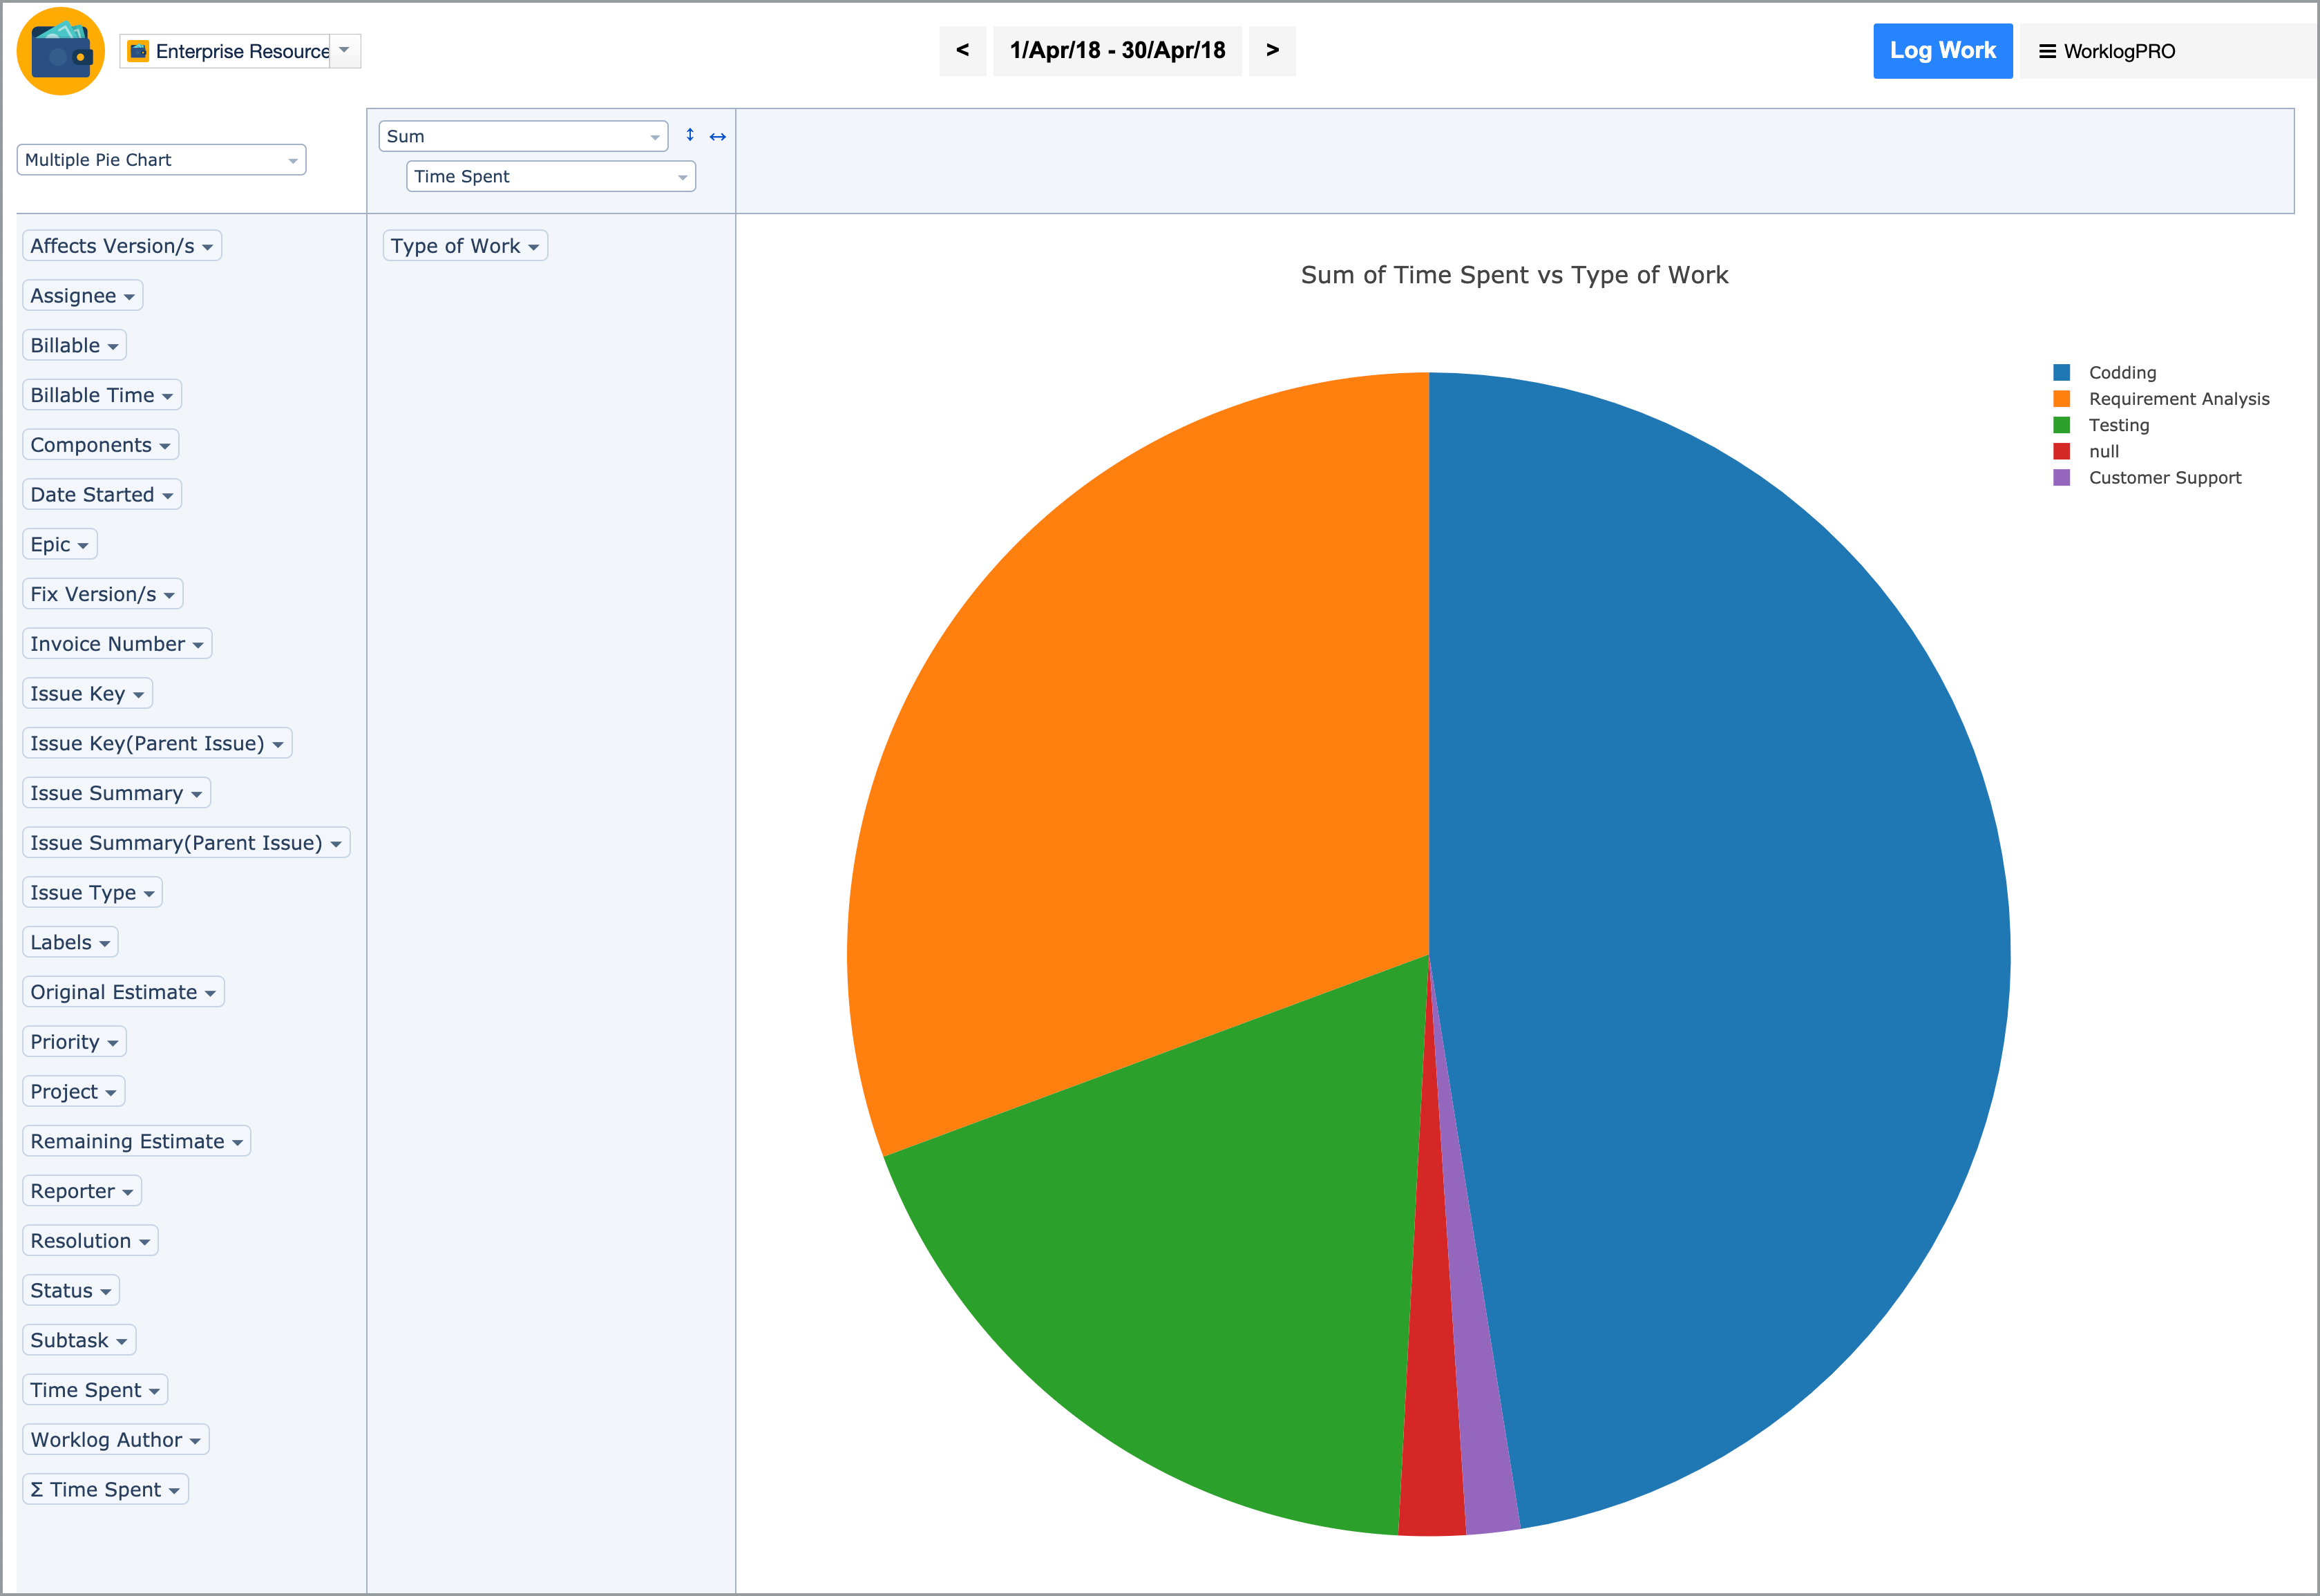
You can also visualize the same data as various charts. In the following screenshot you can see distribution of total time spent between various work types.